Knowing that a Pokémon card is worth $200 today tells you almost nothing. Knowing it was $120 six months ago and $280 three months ago tells you everything.
There is a fundamental difference between checking a card's price and tracking a card's value. Checking is a snapshot; tracking is a movie. As the Pokémon Trading Card Game (TCG) market matures, the distinction between a casual collector and a strategic investor has blurred. Today, if you are collecting with any intent to buy, sell, or hold strategically, you need to treat your collection like a financial portfolio [1].
We talk to collectors every day who made buying or selling decisions based on a single price check. And they regretted it. They sold a card that was in a temporary dip. They bought a card during a release-week hype spike. They held a card through a slow decline because they never noticed the trend. All of these mistakes could have been avoided with basic value tracking.
This comprehensive guide explores why tracking your Pokémon card portfolio matters, the limitations of traditional methods like spreadsheets, and how modern tools like PokéBible are changing the way collectors manage their assets.
Why Tracking Your Pokémon Card Value Over Time Matters
If you just want to know what your card is worth right now, a quick search on TCGPlayer or Cardmarket will do the job. However, tracking your collection over time solves entirely different problems [1].
Timing Your Buys and Sells
Pokémon card prices are cyclical. Most modern cards follow a predictable pattern: prices spike at release, drop over the following weeks as supply increases, stabilize, and then either gradually decline or (for highly sought-after chase cards) slowly climb as sealed product dries up. Understanding where a card sits in this cycle helps you avoid buying at the top.
For example, tracking the price of an Alternate Art card from release allows you to see the initial hype pricing, the correction, and the stabilization point. Buying during the correction can save you 30-40% compared to buying during release week.
Identifying Market Trends
Individual card tracking rolls up into broader market intelligence. When you track multiple cards from the same era, you start to see whether the vintage market is heating up or cooling down, whether modern chase cards hold value or bleed over time, and whether certain card types (like Special Illustration Rares) trend differently from others.
Portfolio Management and P&L
If you have more than a handful of valuable cards, tracking their combined value over time turns a collection into a managed portfolio. You can see your total collection value change month over month, identify which cards are dragging performance down, and make informed decisions about rebalancing: selling depreciating cards and buying appreciating ones.
More importantly, tracking allows you to calculate your Profit and Loss (P&L) and Cost Basis. If you bought a Booster Box for $100 and pulled a $150 card, your cost basis for that card isn't $0; it's intrinsically tied to the cost of the box. Knowing exactly what you spent versus what your collection is currently worth is the cornerstone of smart collecting.
Knowing When to Grade
This is an underappreciated benefit of tracking. If a raw card's value has been climbing steadily, and the PSA 10 version commands a 3x premium, that trend data helps you decide whether it is worth paying for grading. If the trend is flat or declining, the grading cost and turnaround time might not be justified [1].
The Evolution of Collection Tracking: From Spreadsheets to Apps
For years, collectors have debated the best way to track their cards. A look at community discussions on platforms like Reddit reveals a constant search for the perfect tool [2]. Let's compare the most common methods used in 2026.
1. The Traditional Method: Manual Spreadsheets
A surprising number of serious collectors still track card values in Excel or Google Sheets.
The Pros: Complete customization. You can track exactly what you want, calculate your own cost basis, and add notes about where you bought the card or its specific condition.
The Cons: It is a logistical nightmare. Every time you want to know what your collection is actually worth, you have to manually check three different sites, convert currencies, and update rows of data. It is time-consuming, prone to human error, and provides no historical charting unless you manually log prices every week.
2. General Marketplaces: TCGPlayer and Cardmarket
Many collectors use the "Collection" features built into major marketplaces.
The Pros: The pricing data is accurate because it is tied directly to actual sales on that specific platform.
The Cons: They are fundamentally designed for buying and selling, not portfolio management. TCGPlayer does not track graded cards well, and neither platform gives you a holistic view of your P&L. Furthermore, they are regionally locked. TCGPlayer reflects the US market, while Cardmarket reflects Europe. If you buy and sell globally, you are only seeing half the picture.
3. First-Generation Apps: Collectr and PriceCharting
Apps like Collectr and websites like PriceCharting were massive steps forward for the hobby [1] [2].
The Pros: PriceCharting is excellent for deep, long-term historical data, especially for vintage cards. Collectr offers a clean mobile interface and quick scanning, making it easy to add cards to a digital binder [1] [2].
The Cons: While they show current estimated values, they lack deep financial analytics. Collectors often note that pricing data can feel aggregated without context, and these tools generally do not offer robust P&L tracking or cost basis analysis [2]. They tell you what your collection is worth today, but they struggle to tell you exactly how much money you have made or lost since you started collecting.
Enter PokéBible: The "Finary" for Pokémon Cards
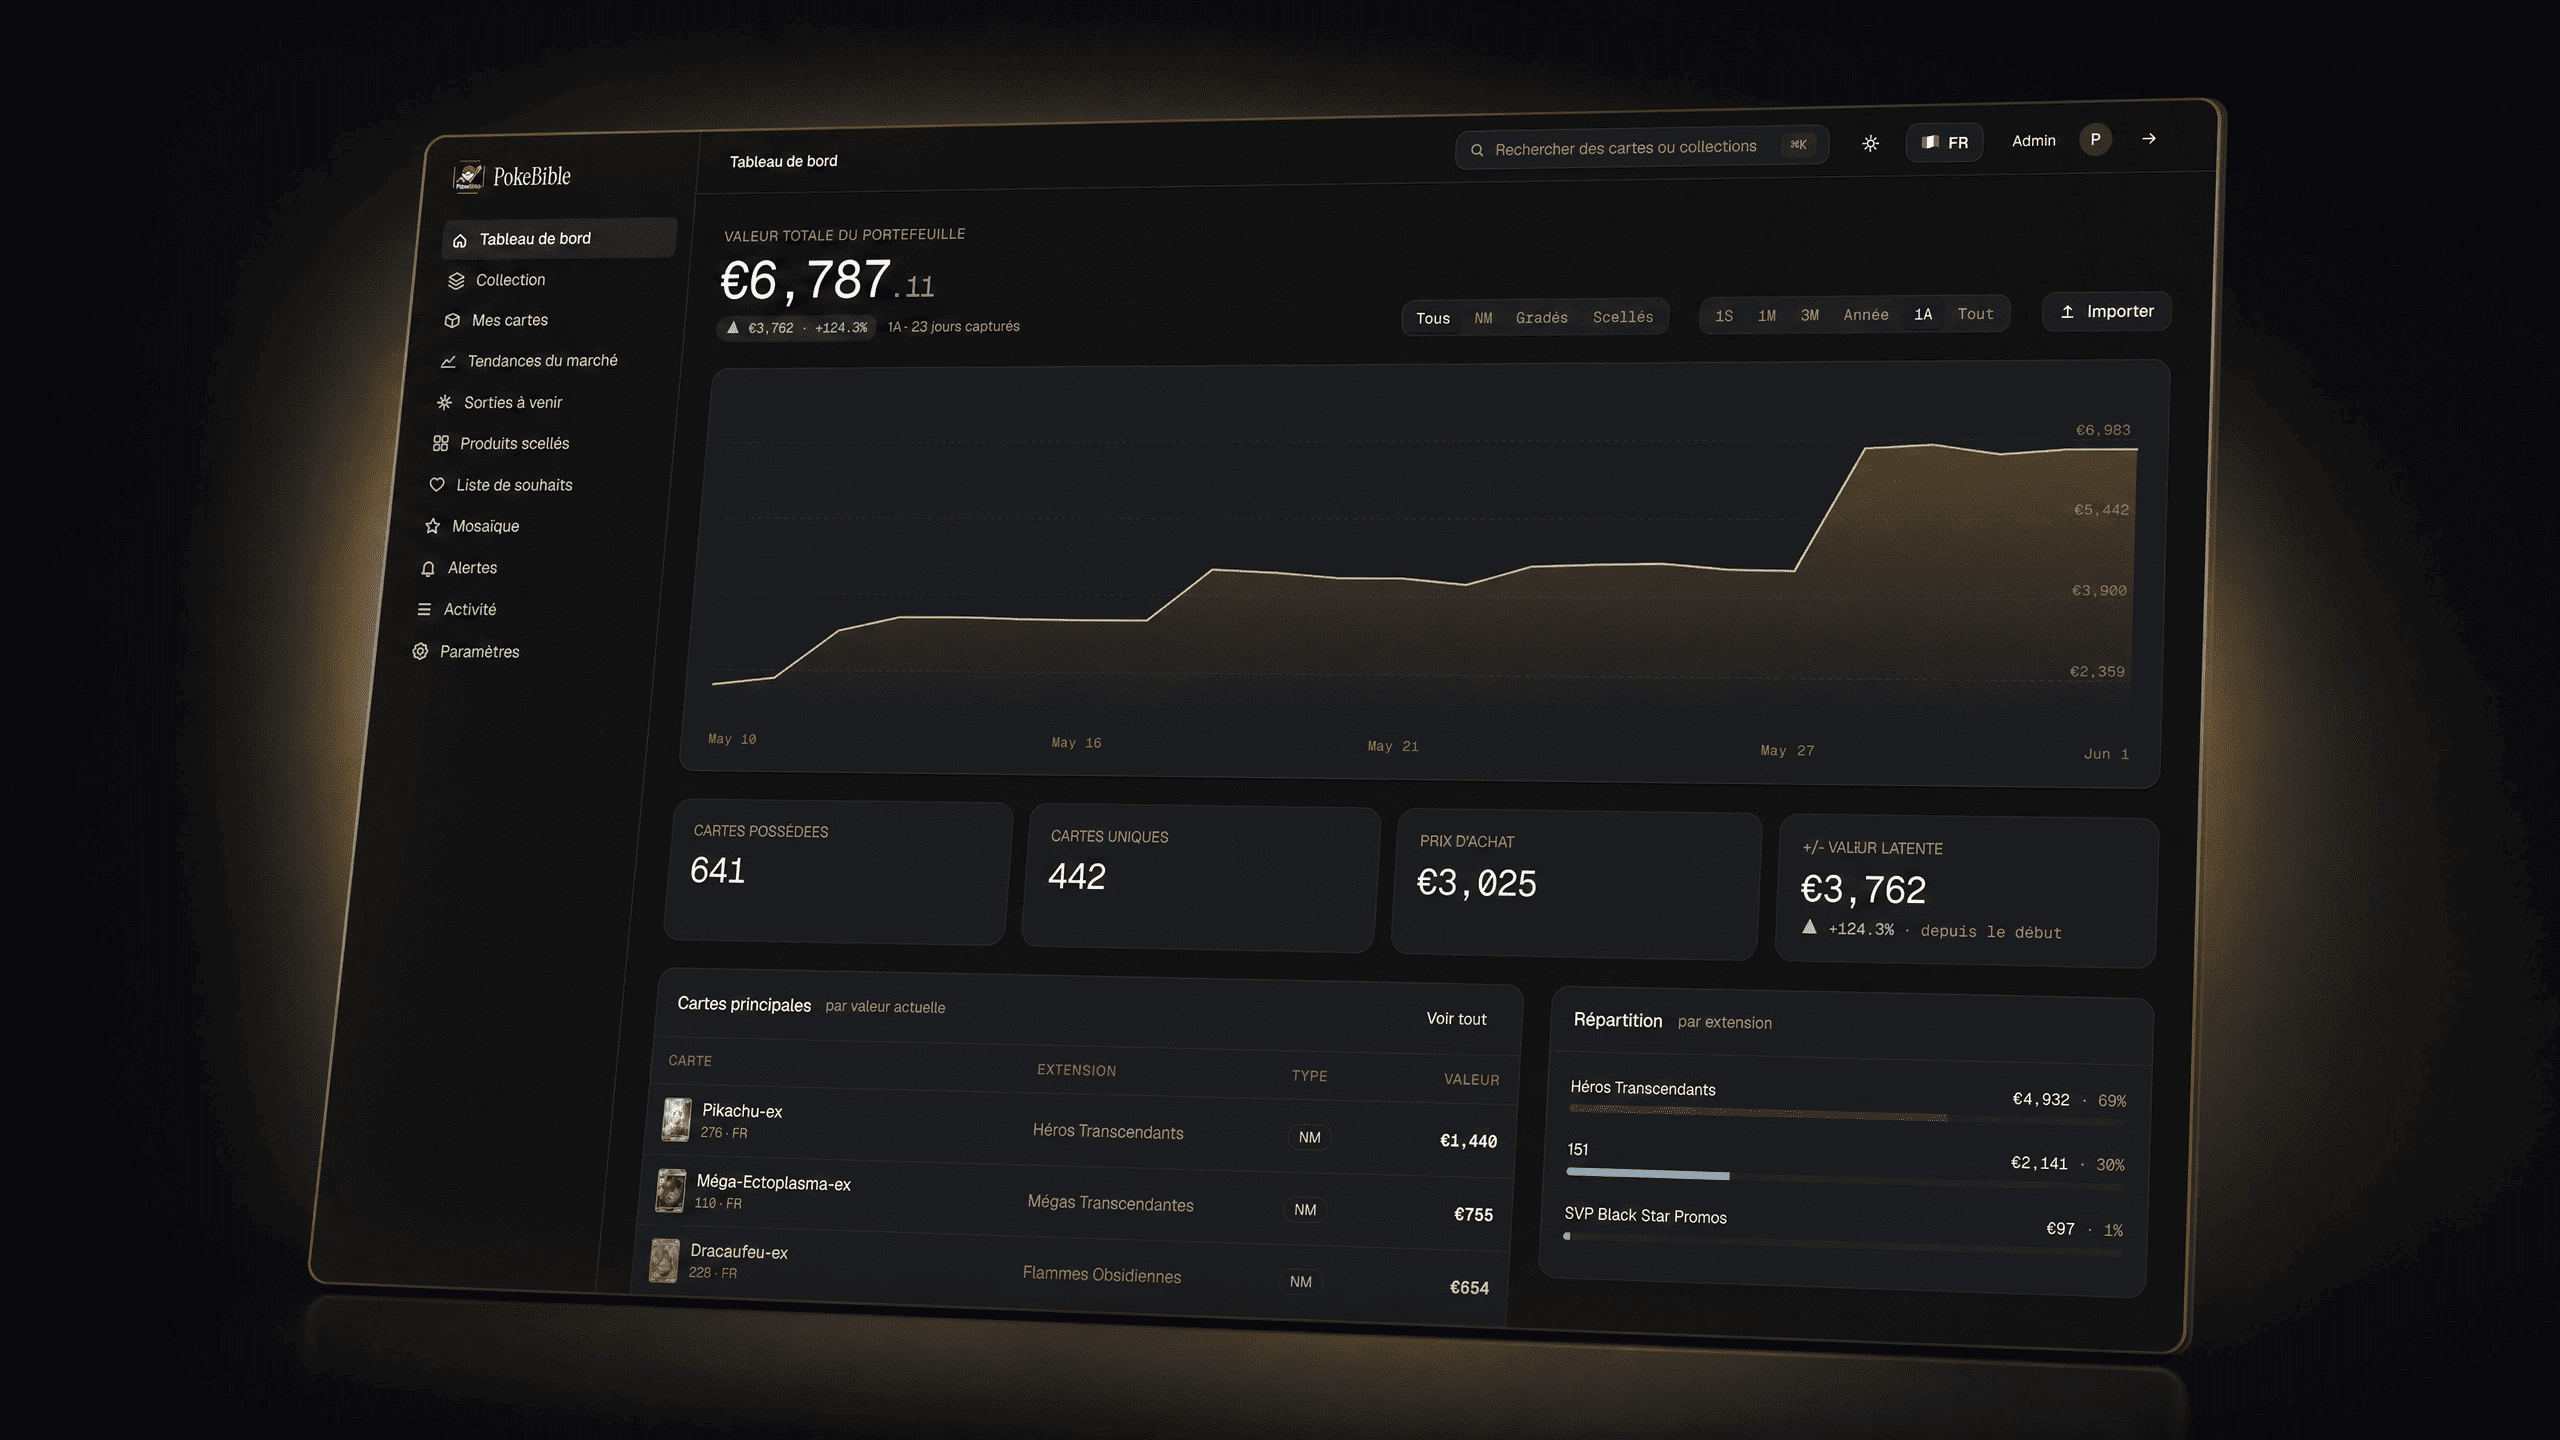
As the market has evolved, so have the needs of collectors. The modern collector doesn't just want a digital binder. They want a financial dashboard. That's exactly what PokéBible was built for.
Designed specifically for the intersection of collecting and investing, PokéBible treats your Pokémon cards like a true financial portfolio.
Real-Time Aggregation Across 5 Marketplaces
The biggest flaw in most tracking apps is reliance on a single data source. The value of a card in the US (TCGPlayer) can differ wildly from its value in Europe (Cardmarket) or Japan. PokéBible solves this by aggregating real-time prices across TCGPlayer, Cardmarket, eBay, and more. You get a true global valuation, not a regional echo chamber.
True P&L and Cost Basis Tracking
This is the game-changer. PokéBible allows you to input exactly what you paid for a card (your cost basis). The dashboard then calculates your Profit and Loss (P&L) in real-time. You don't just see that your collection is worth $5,000; you see that you spent $3,200 to acquire it, giving you a clear +$1,800 (+56%) return on investment.
Graded Cards and Sealed Products
A portfolio isn't just raw singles. PokéBible tracks graded cards (PSA, CGC, BGS) and sealed products (Booster Boxes, Elite Trainer Boxes) with the same level of financial granularity.
Price Alerts and Market Insights
Instead of manually checking prices every day, PokéBible allows you to set custom price alerts. If a chase card you are watching drops by 15%, you get notified. If a card in your portfolio spikes, you know immediately.
How to Start Tracking Your Portfolio Today
Transitioning from a messy spreadsheet or a basic app to a true portfolio tracker is easier than you might think.
- Audit Your Collection: Start by gathering your most valuable cards. You don't need to track every $0.10 bulk common. Focus on your "hits": Ultra Rares, Secret Rares, Alternate Arts, graded slabs, and sealed boxes.
- Find Your Receipts: To get the most out of P&L tracking, try to find what you originally paid for these items. Check your eBay purchase history, TCGPlayer orders, or LGS receipts.
- Scan and Add: Use the PokéBible mobile app to scan your cards directly into your portfolio. Input your purchase price for each item.
- Monitor the Dashboard: Let the platform do the heavy lifting. Watch your dashboard to see how market fluctuations impact your overall net worth.
Conclusion
The days of guessing the value of your Pokémon card collection are over. Whether you are holding a few childhood base set holos or actively speculating on modern alternate arts, treating your collection like a portfolio is the only way to make informed decisions.
While spreadsheets offer control and basic apps offer convenience, true financial tracking requires a dedicated tool. By aggregating global marketplaces and focusing on real Profit & Loss metrics, PokéBible provides the clarity that modern collectors need.
Stop guessing. Start tracking.
References
[1] Misprint Editorial. "Best Place to Track Pokemon Card Values Over Time (Tools Compared)". Misprint. https://www.misprint.com/posts/best-place-to-track-pokemon-card-values
[2] Reddit Community. "Discussion: What apps do you use to track/value your collection?". r/pokemoncardcollectors. https://www.reddit.com/r/pokemoncardcollectors/comments/1hnp96u/discussion_what_apps_do_you_use_to_trackvalue/